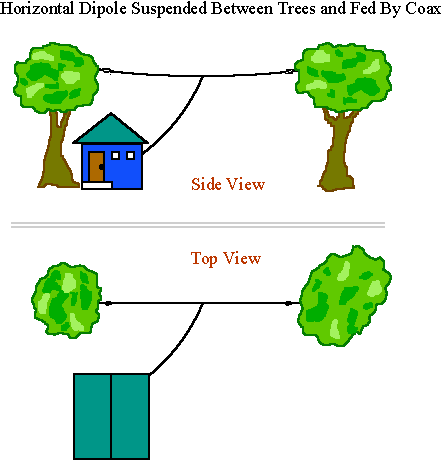
A feedline can effect the pattern and feedpoint impedance of a antenna (even if a balun is used). The next problem, which is typical of many Ham Radio antenna installations, and the following J-pole problem, will both be used to illustrate the effect of feedlines.
Notice that the feedline is at a skew angle to the dipole. The model will be made based on a frequency of 10.15 MHz and Poor ground. The feedline will be grounded at the bottom end to conform to a grounded transmitter.
It is necessary to make a model for each case that it is desired to investigate. The first model will be the bare dipole with no feedline.
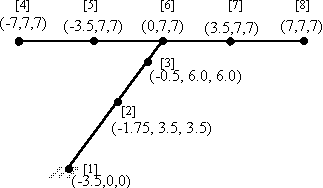
The x,y,z coordinates are inclosed in parenthesis "( )" and the node number in brackets "[ ]". In this example we haven't been fussy about modeling the center droop so the dipole is just straight.
The next two models will add the feedline to the problem. When considering the effects of
feedlines it should pointed out that it is often not appreciated that a coax cable is really
three conductors at RF.
The three are:
The outer conductor of the coax is just as much a "wire" as any other wire in the system. It is not necessary, however, to model the inner conductor and the inner surface of the outer conductor. So the coax is just modeled as another wire.
The next model will be a coax feedline that has its outer conductor directly connected to the dipole (i.e. no balun). This is done, as suggested above, by just adding another wire. Since the feedline is going to be grounded at the lower end representing the grounding of the transmitter, the first node has to be the grounded point; this requires renumbering the nodes as shown.
Once again this is just an example; no pains have been taken to make the geometry conform to any particular arrangement.
The last arrangement is a simulation of a feedline connected to the dipole with a perfect balun. The perfect balun is simulated by breaking the connection between the feedline and the dipole. This is done by removing the connection between node 3 and node 6.
The input file corresponding to this set of test cases is:
C    Dipole With Feedline Example
C    To show effects of Feedline Current
C
C    First - model bare dipole
C
WIRE(RADIUS=.001)
GROUND(POOR)
GXYZ
 -7	7	7
 -3.5	7	7
 0	7	7
 3.5	7	7
 7	7	7
XXXX
DNODE
1 2
2 3
3 4
4 5
XXXX
FEED(3)
FREQ(10.15)
OUTPUT(FARF=0,0,-90,90)
CHANGE
OUTPUT(FARF=90,90,-90,90)
END
C    Dipole With Feedline Example
C    To show effects of Feedline Current
C
C    FEEDLINE CONNECTED TO DIPOLE
C      FEEDLINE IS GROUNDED AT LOWER END
C    Note use of GENERATOR rather than FEED
C
WIRE(RADIUS=.001)
GROUND(POOR)
GXYZ
 -3.5	0	0	/ Lower end of feedline (grounded)
 -1.75	3.5	3.5
 -0.5	6.0	6.0	/ top end of feedline
 -7	7	7    / start of dipole
 -3.5	7	7
 0	7	7
 3.5	7	7
 7	7	7
XXXX
DNODE
1 2  / lower end of feedline
2 3  / upper end of feedline
4 5   / start of dipole
5 6   /       *
6 7   /       *
7 8   / end of dipole
3 6  / connection between feedline and dipole
XXXX
GENE(4)
FREQ(10.15)
OUTPUT(FARF=0,0,-90,90)
CHANGE
OUTPUT(FARF=90,90,-90,90)
END
C    Dipole With Feedline Example
C    To show effects of Feedline Current
C
C    FEEDLINE Isolated from DIPOLE
C      FEEDLINE IS GROUNDED AT LOWER END
C
C
WIRE(RADIUS=.001)
GROUND(POOR)
GXYZ
 -3.5	0	0	/ Lower end of feedline (grounded)
 -1.75	3.5	3.5
 -0.5	6.0	6.0	/ top end of feedline
 -7	7	7    / start of dipole
 -3.5	7	7
 0	7	7
 3.5	7	7
 7	7	7
XXXX
DNODE
1 2  / lower end of feedline
2 3  / upper end of feedline
4 5   / start of dipole
5 6   /       *
6 7   /       *
7 8   / end of dipole
XXXX
FEED(6)
FREQ(10.15)
OUTPUT(FARF=0,0,-90,90)
CHANGE
OUTPUT(FARF=90,90,-90,90)
STOP
Results for the main polarized signal components.
The following plots show the subtle effect on the main polarization component. Note that the
power scale is linear (not dB).
(In order to process these plots to be placed on this webpage, the data from
the ASAP output file was cut and pasted into a spreadsheet and formatted,
then copied into MathCad. MathCad was used to create the polar plot which
was then copied as a picture into Powerpoint for "image enhancement". A
bitmap of the screen was then saved and converted to a GIF file.)
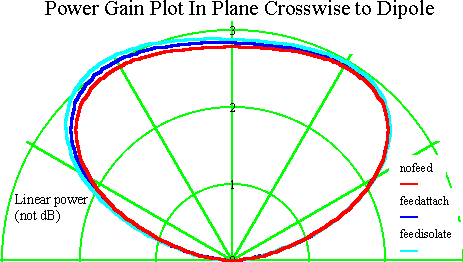
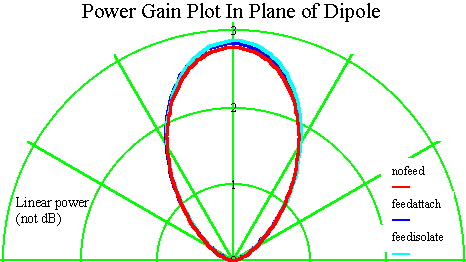
As can be seen, presence of a feedline doesn't effect the main polarized pattern too much in this example. A small cross polarized component (not shown) is introduced by the feedline. The main effect is with the feedpoint impedances.
| Case | Feedpoint Impedance |
|---|---|
| No Feedline | 72.1946000 + J -29.9455100 |
| Feedline Connected | 125.3717000 + J -60.0663800 |
| Ideal Balun | 69.4263200 + J -29.6776600 |
The obvious conclusion is that the feedline can have a significant effect on the input impedance of an antenna even if the pattern is not significantly distorted. Notice that there is some effect even using the ideal balun. Routing the feedline at right angles to the dipole would minimize the interaction in that case.
See J-Pole, Using Preprocessors where the J-pole antenna will be used as an example of both a case where the presence of a feedline does make a significant pattern difference as well as an example of how a simple geometry processor might be used.
Back to: Examples Index Page
Including:
See also the quick reference for the user's guide.
Goto Systems Manual
(Theory of Operation)
Return to ASAP Homepage
Last modified on: Saturday, 3 Nov 2007