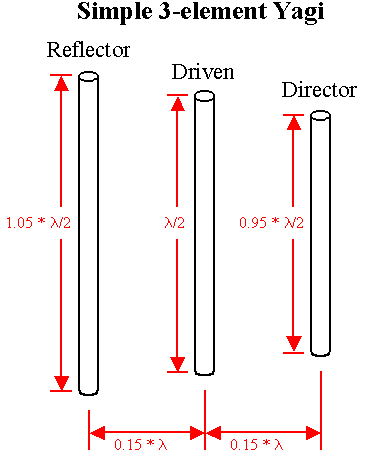

Below is an diagram illustrating a simple three-element yagi that it is desired to analyze. The dimensions are given in wavelengths.

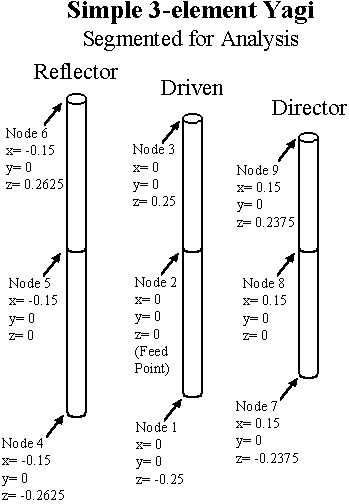
If a frequency of 300 MHz is chosen for the problem (the default in the absence of a FREQ card) then the problem dimensions in meters will also be directly in terms of wavelength. We will choose the have the axis of the beam along the x-axis of the coordinate system with the feed point of the director at coordinates x=0, y=0, z=0. Each individual element must have a minimum of 3 nodes and two segments so one will be defined for the middle and each end. Actually it would be better to have more segments so that the minimum segment would be less than .25 wavelength but two segments per element will be used simplify the diagram and input file. The segmentation, along with the node numbering scheme that will be used, is shown in the diagram below.

Notice that the support beam for the elements has been omitted from the problem under the assumption that it is nonconducting. For more about modeling support booms see the special section on thin wires / thick wires especially the section on modeling a yagi with a boom.
The feedline has also been omitted under the assumption that it is routed and decoupled sufficiently not to effect the antenna's performance. This last assumption is often not true in practice and should be modeled in most situations. To keep this example simple it will not be done here. For more about this see the Feedline Effects Example
The input file shown below is constructed for this problem. First the Comment "cards" are constructed taking care to leave 4 spaces after the 'C'. Note that the text of the comment may be upper and lowercase but that everything else must be all uppercase. For this example a wire radius of 0.001 meter (1 millimeter or in this case 0.001 wavelength) has been chosen. Note that the limits on the thin wire condition will limit the choice of wire diameter to 0.01 wavelength or less. The GXYZ and DNODE form of geometry input was used. This format allows comments to be placed after each geometry point so that it is easier to see what is going on. (The rest of the input file description is after the example file.)
C    3 element Yagi
C
WIRE(RADIUS=.001)
GXYZ
0 	0 	-0.25	/ Driven element node 1
0 	0 	 0	/ Driven element node 2
0 	0 	 0.25	/ Driven element node 3
-0.15 	0 	-0.2625	/ Reflector element node 4
-0.15 	0 	 0	/ Reflector element node 5
-0.15	0 	 0.2625	/ Reflector element node 6
 0.15 	0 	-0.2375	/ Director element node 7
 0.15 	0 	 0	/ Director element node 8
 0.15	0 	 0.2375	/ Director element node 9
XXXX
DNODE
1 2
2 3
4 5
5 6
7 8
8 9
XXXX
FEED(2)
FREQ(300)
PLOT(FARF/THETA=90)
CHANGE
OUTPUT(CURRENTS/FARF=0,0,+90,+90)
CHANGE
FREQ(301)
PLOT(FARF/THETA=90)
CHANGE
OUTPUT(CURRENTS/FARF=0,0,+90,+90)
CHANGE
FREQ(299)
PLOT(FARF/THETA=90)
CHANGE
OUTPUT(CURRENTS/FARF=0,0,+90,+90)
STOP
(Note: Although this example is not provided as a separate file, it is possible to copy it from a web-browser display by highlighting it with the cursor and choosing "Copy" from the "Edit" menu. To use the file as an input to ASAP, paste the data into an ASCII editor and save it.)
From the diagram it is seen that the center of the driven element is node 2 so a FEED "card" is added to the input file as "FEED(2)" to specify this. The frequency is explicitly set to 300 MHz using the FREQ card. It is desired to obtain a quick plot using ASAP's line printer plot feature so the PLOT card is added specifying that the far field pattern is desired taken in the THETA=90 degrees (that is the xy) plane. It is also desired to have the currents on the structure and the far field pattern printed in tabular form so an OUTPUT card is used. It is only desired to have the values of gain an far field pattern printed at the peak gain direction so the phi angle is set to run from 0 degrees to 0 degrees and the theta angle is set to run from 90 degrees to 90 degrees. This would not work if the PLOT card was in the same data block with the OUTPUT card as the PLOT card overrides and would cause the values to be printed for all 360 degrees. A CHANGE card is used to separate the two cards so that this overriding effect will not occur.
The input file is always ended with a STOP card. The stop card should be followed by a blank line to insure that the ASAP input routines know that the last card has been read.
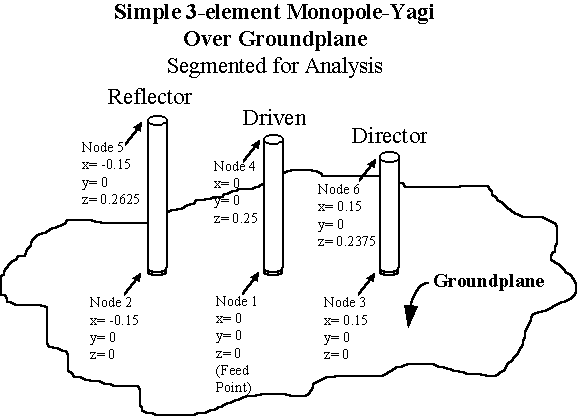
Suppose that it is now desired to analyze a similar structure only using monopoles over a ground plane in place of full length elements in free space. Since the three elements will be contacting the ground plane it is necessary to obey the rules regarding points touching the ground plane: all points that touch the ground plane must be listed in the geometry description first so that they are the lowest numbered points.
In the diagram below, the groundplane has been added, the nodes below the groundplane have been deleted and the nodes have been renumbered in accordance with the rules .

Note that nodes 1, 2, and 3 touch the groundplane and that node 1 is now the feedpoint.
Now that the elements are on a groundplane, the omission of the support beam and the feedline from the model are less questionable.
The input file for this arrangement is:
C    3 element Yagi
C
WIRE(RADIUS=.001)
GROUND(PERFECT)
GXYZ
0 	0 	 0	/ Driven element node 1 Touches groundplane
-0.15 	0 	 0	/ Reflector element node 2 Touches groundplane
 0.15 	0 	 0	/ Director element node 3 Touches groundplane
0 	0 	 0.25	/ Driven element node 4
-0.15	0 	 0.2625	/ Reflector element node 5
 0.15	0 	 0.2375	/ Director element node 6
XXXX
DNODE
1 4
2 5
3 6
XXXX
FEED(1)
FREQ(300)
PLOT(FARF/THETA=90)
CHANGE
OUTPUT(CURRENTS/FARF=0,0,+90,+90)
CHANGE
FREQ(301)
PLOT(FARF/THETA=90)
CHANGE
OUTPUT(CURRENTS/FARF=0,0,+90,+90)
CHANGE
FREQ(299)
PLOT(FARF/THETA=90)
CHANGE
OUTPUT(CURRENTS/FARF=0,0,+90,+90)
STOP
Note the rearrangement of the points and the connection list.
A feedline can effect the pattern and feedpoint impedance of a antenna (even if a balun is used). The next problem, which is typical of many Ham Radio antenna installations, and the following J-pole problem, will both be used to illustrate the effect of feedlines.
Back to: Examples Index Page
Including:
See also the quick reference for the user's guide.
Goto Systems Manual
(Theory of Operation)
Return to ASAP Homepage
Last modified on: 3 Nov 2007